The complete chip quality program for pulp & paper mills and their suppliers — sampling, real-time analytics on every metric, generated values like recoverable fiber, and supplier accountability in one platform.
The Chip Lab gives mills and their suppliers real-time feedback the moment samples are taken — catching drift before it reaches the digester and holding every supplier to the same standard. Book a demo and take control of chip quality today.
In kraft cooking, chip thickness is the rate-limiting dimension: fines and pins overcook, over-thick chips come back as rejects, bark steals yield, and excess moisture is water bought at wood prices. And because the digester cooks for the worst chip in the load, inconsistent quality drives up chemical and energy use across the board.
Sustained quality — every supplier, every load — is how mills protect yield and margins. Our roots are in pulp & paper, but if you buy wood fiber by the ton, the program fits.
Read: how chip quality drives pulp yield →True fiber cost
A load of chips is priced by the green ton — water, bark, and all. Like buying oranges for juice, the sticker price isn't what the juice costs. Three measured steps take you from the invoice to the number procurement can actually rank suppliers on.
What you pay at the scale — wood, water, and bark at one price.
At typical moisture, barely half of every ton is wood. The rest is water bought at wood prices.
Fines overcook; over-thick chips reject. Recoverable fiber is the measured share that survives.
Every step measured — none modeled.
Defaults are an illustrative "typical" supplier. Change any number — the true cost updates instantly.
The Platform
The only platform purpose-built for chip quality management — delivering real-time feedback from your samples as soon as they're taken, weighted by delivery tonnage so your numbers reflect what actually crossed the scale.
Trusted by industry leaders












…as well as thousands of suppliers who collaborate through our platform. * Formerly known as Chip MACS or TVCD.
 The Chip Lab
| Jan | Feb | Mar | Apr | May | Jun | Jul | Aug | Sep | Oct | Nov | Dec | |
|---|---|---|---|---|---|---|---|---|---|---|---|---|
| RW Chipper | 91.05 | 87.80 | 92.40 | 92.73 | 90.28 | 90.18 | 92.60 | 92.87 | 87.75 | 91.66 | 91.36 | 87.24 |
| Chip Plants | 91.38 | 95.57 | 92.74 | 94.09 | 91.74 | 91.36 | 93.22 | 94.06 | 95.56 | 94.18 | 93.17 | 91.96 |
| Purch. Chips | 80.66 | 86.43 | 83.65 | 86.13 | 91.13 | 90.94 | 84.47 | 88.33 | 88.83 | 89.41 | 87.77 | 80.30 |
| — RW Chips | 92.83 | 85.57 | 91.46 | 91.78 | 87.06 | 86.09 | 89.19 | 84.22 | 86.13 | 85.22 | 90.30 | 87.99 |
| Jan | Feb | Mar | Apr | May | Jun | Jul | Aug | Sep | Oct | Nov | Dec | |
|---|---|---|---|---|---|---|---|---|---|---|---|---|
| RW Chipper | 0.65 | 0.15 | 0.80 | 0.42 | 0.59 | 0.86 | 0.39 | 0.61 | 0.89 | 0.72 | 0.71 | 0.66 |
| Chip Plants | 0.50 | 0.24 | 0.36 | 0.72 | 0.85 | 0.88 | 0.83 | 0.47 | 0.55 | 0.45 | 0.22 | 0.36 |
| Purch. Chips | 0.70 | 0.95 | 0.35 | 1.15 | 0.72 | 1.30 | 1.03 | 1.42 | 0.74 | 1.44 | 1.31 | 1.38 |
| — RW Chips | 1.10 | 0.65 | 0.12 | 0.60 | 0.36 | 1.13 | 0.90 | 0.12 | 0.67 | 0.76 | 0.33 | 0.55 |
| Jan | Feb | Mar | Apr | May | Jun | Jul | Aug | Sep | Oct | Nov | Dec | |
|---|---|---|---|---|---|---|---|---|---|---|---|---|
| RW Chipper | 43.11 | 43.36 | 49.11 | 47.16 | 43.31 | 49.72 | 48.27 | 48.49 | 48.43 | 46.36 | 42.38 | 42.23 |
| Chip Plants | 44.29 | 49.50 | 45.03 | 45.67 | 43.22 | 44.75 | 49.37 | 47.87 | 45.69 | 42.96 | 49.06 | 49.74 |
| Purch. Chips | 41.93 | 51.97 | 57.00 | 43.13 | 61.97 | 49.68 | 54.15 | 49.38 | 60.83 | 49.43 | 59.77 | 59.00 |
| — RW Chips | 50.61 | 51.44 | 46.40 | 51.41 | 47.82 | 44.05 | 47.57 | 46.29 | 47.23 | 43.57 | 46.48 | 45.52 |
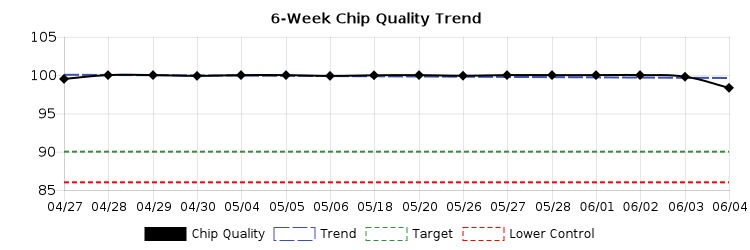
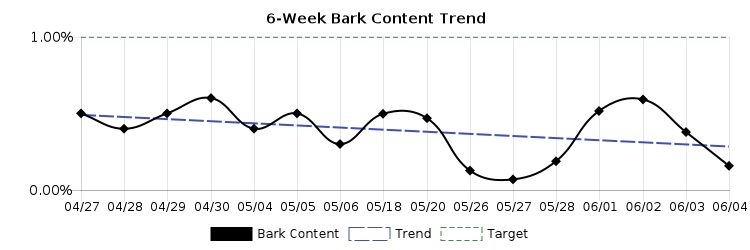
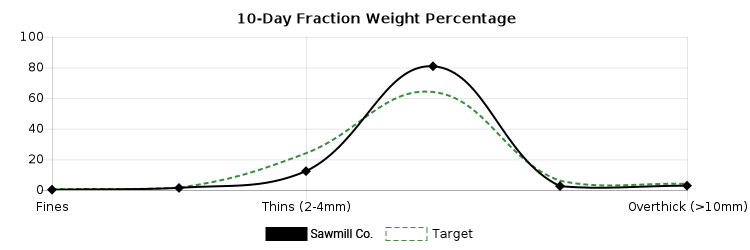 The Chip Lab
| Supplier | Moisture | Bark | Recov. fiber | $ / usable ton |
|---|---|---|---|---|
| Supplier A | 42% | 0.15% | 94.9 | $172.89 |
| Supplier B | 45% | 0.30% | 93.6 | $185.09 |
| Supplier C | 48% | 1.27% | 90.6 | $204.24 |
Insights, delivered
Get the reports you need, when and how you need them. The Chip Lab's reporting engine adapts to your workflow — automate, customize, and deliver insights to every stakeholder.
No matter your process, The Chip Lab ensures your data is always at your fingertips — ready to drive better decisions.
Get started
Add your mill, suppliers, users, and quality targets in minutes. Configure CAPA workflows and scheduled reports so everyone is aligned from day one.
Connect directly to Gradex or RADER for real-time uploads, import from LIMS, upload exports, or enter samples manually — automatically weighted by tonnage.
Track every metric in real time — including generated values like recoverable fiber — get instant alerts, and act while it matters. Sustained quality is what shows up in your margins.
Everything you need
Detect anomalies in chip quality over rolling windows. Get alerted to out-of-process trends before they cause yield loss.
Trigger, assign, and resolve CAPA with full visibility. Close the loop on supplier issues with integrated workflow tools.
Secure your data with flexible, role-based permissions. Control exactly who can view, edit, or manage every part of your account.
Give suppliers secure, role-based access to their own portal to view, enter, and update data and track performance.
Record maintenance, weather, or process changes alongside your chip data and correlate operational actions with quality results.
Real-time reports and instant feedback as soon as samples are taken. Customize, filter, schedule, and share instantly.
Get notified the moment quality drops below your targets, and take corrective action before it impacts production.
Set up custom alarms for any metric or event and notify your team or suppliers by email or in-app instantly.
Instant, automated insights on supplier performance and sample trends — spot issues, opportunities, and outliers fast.
Turn chip data into clear, actionable charts. Visualize deviations, improvements, and supplier performance over time.
Automatically flag new samples for review before they hit live datasets, so only validated data drives decisions.
Export anytime — by supplier, date range, or in bulk — and integrate with your own systems in standard formats.
Group suppliers by region, contract, or tag. Analyze performance, apply rules, and automate actions per group.
Monitor, back up, and restore your automatic chip classifiers (Gradex, RADER) to protect data and minimize downtime.
Combine sample data across suppliers, timeframes, or specs to benchmark performance and drive smarter decisions.
Get help from real experts, fast. Our support team is available by phone or email to resolve issues quickly.
We are always adding new features and enhancements so you can stay ahead of the curve in chip quality management.
See The Chip Lab in action — book a demo and our team will get you set up.
Book a Demo